


The first-ever of its kind, Mostek Law has completed a multi-year study of enforcement actions by the Nebraska Department of Environmental Quality (NDEQ). The actions resulted in civil penalties, administrative orders, or both. Through this introduction and a series of articles to follow, we will share some insight and provide simple conclusions based on the data.
Total civil penalties levied by NDEQ over 17 years, from 2000 through 2016 total more than $11.34 Million. From 2006 through 2016, 188 civil penalty cases are reported resulting in more than $6.4 Million of civil penalties levied against Nebraskans and Nebraska industry. And, from 2010 to 2016, the NDEQ issued 136 administrative orders to individuals, businesses, municipalities and others in Nebraska.
Methodology
NDEQ Public Information. Our initial effort focused on civil penalty cases from 2006 through 2016. Over the course of two years, our staff downloaded, analyzed and compiled summaries of the complaint and settlement orders in completed civil penalty cases.
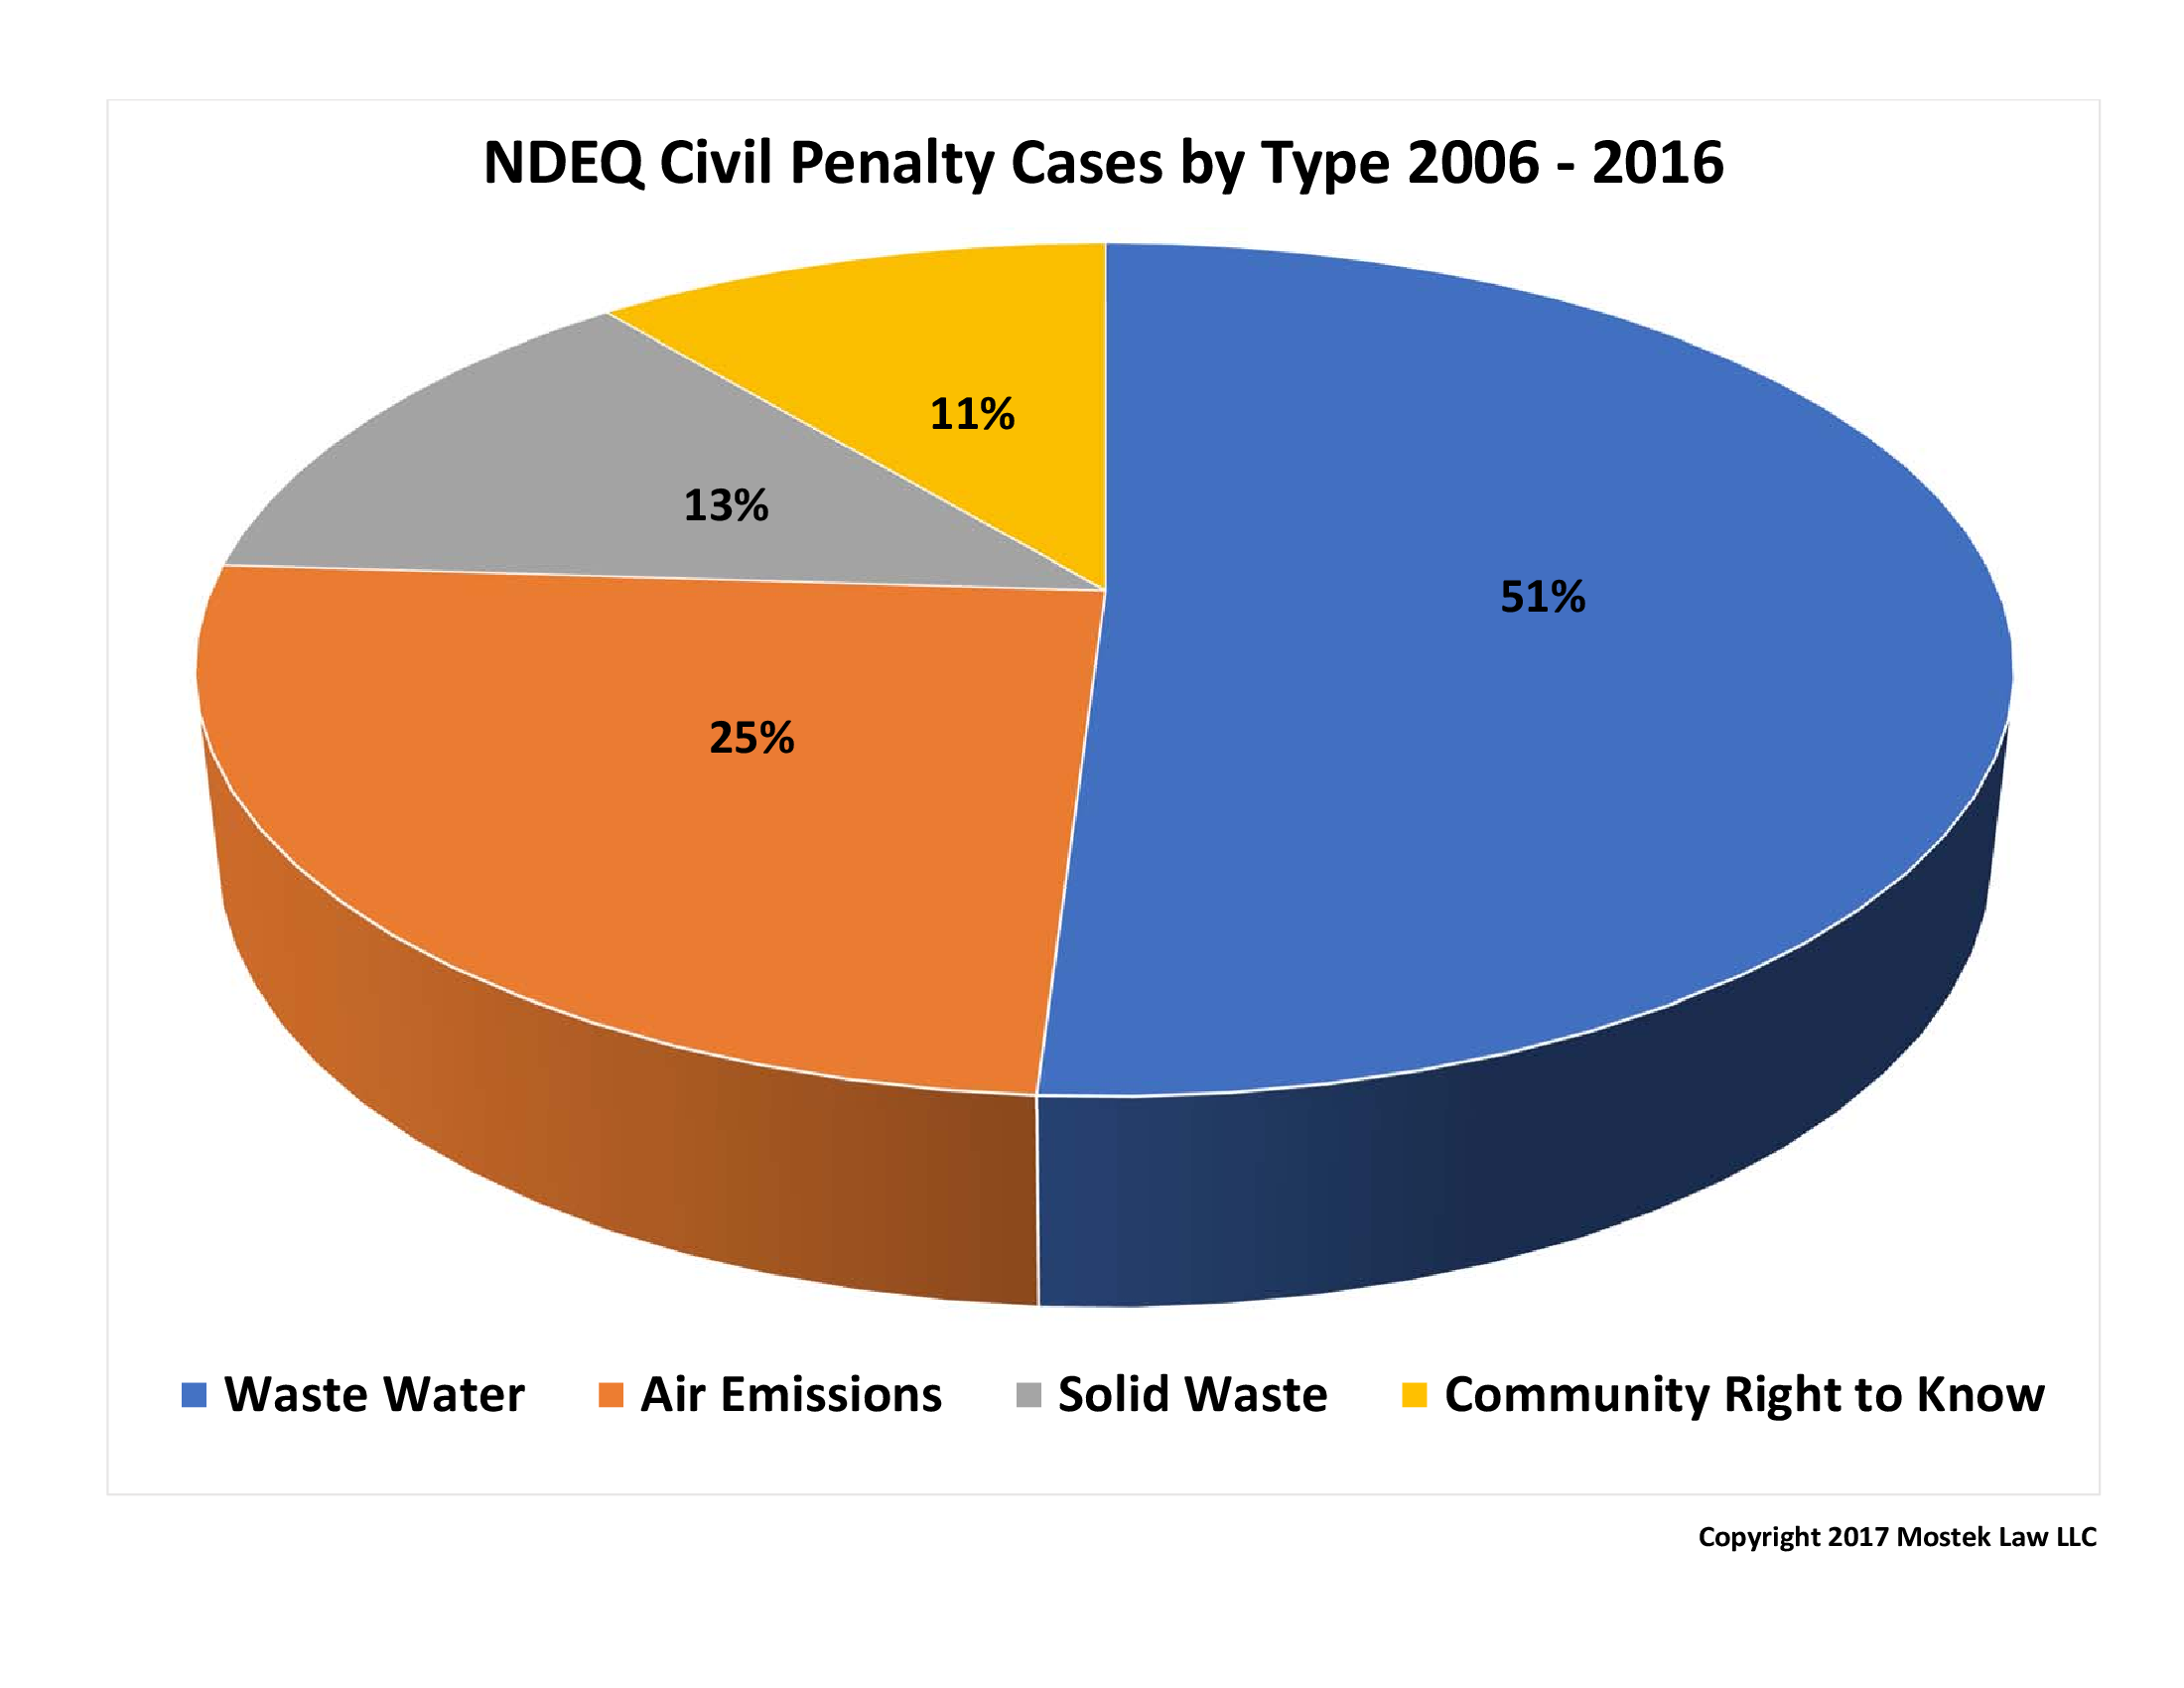
Figure 1 – NDEQ Civil Penalty Summary
Civil penalty judicial proceedings were available for download on the NDEQ website beginning with 2006 cases. Over this time, from 2006 through 2017, 188 cases are reported resulting in more than $6.4 million of civil penalties levied against Nebraskans and Nebraska industry.
We also studied the administrative orders issued by the NDEQ from 2010 through using the same methods, again drawing information on administrative proceedings directly from the NDEQ website. From 2010 to 2016, 136 administrative orders were issued to individuals, businesses, municipalities and others. Typically, administrative orders do not include civil penalties against regulated party. Rather, these orders are used to compel regulated parties to comply with the environmental laws and regulations.
Taking our research a step further, we then categorized each civil penalty case and administrative order according to the type of environmental program involved. For example, we have categories for waste water, solid waste, air emissions and so forth.
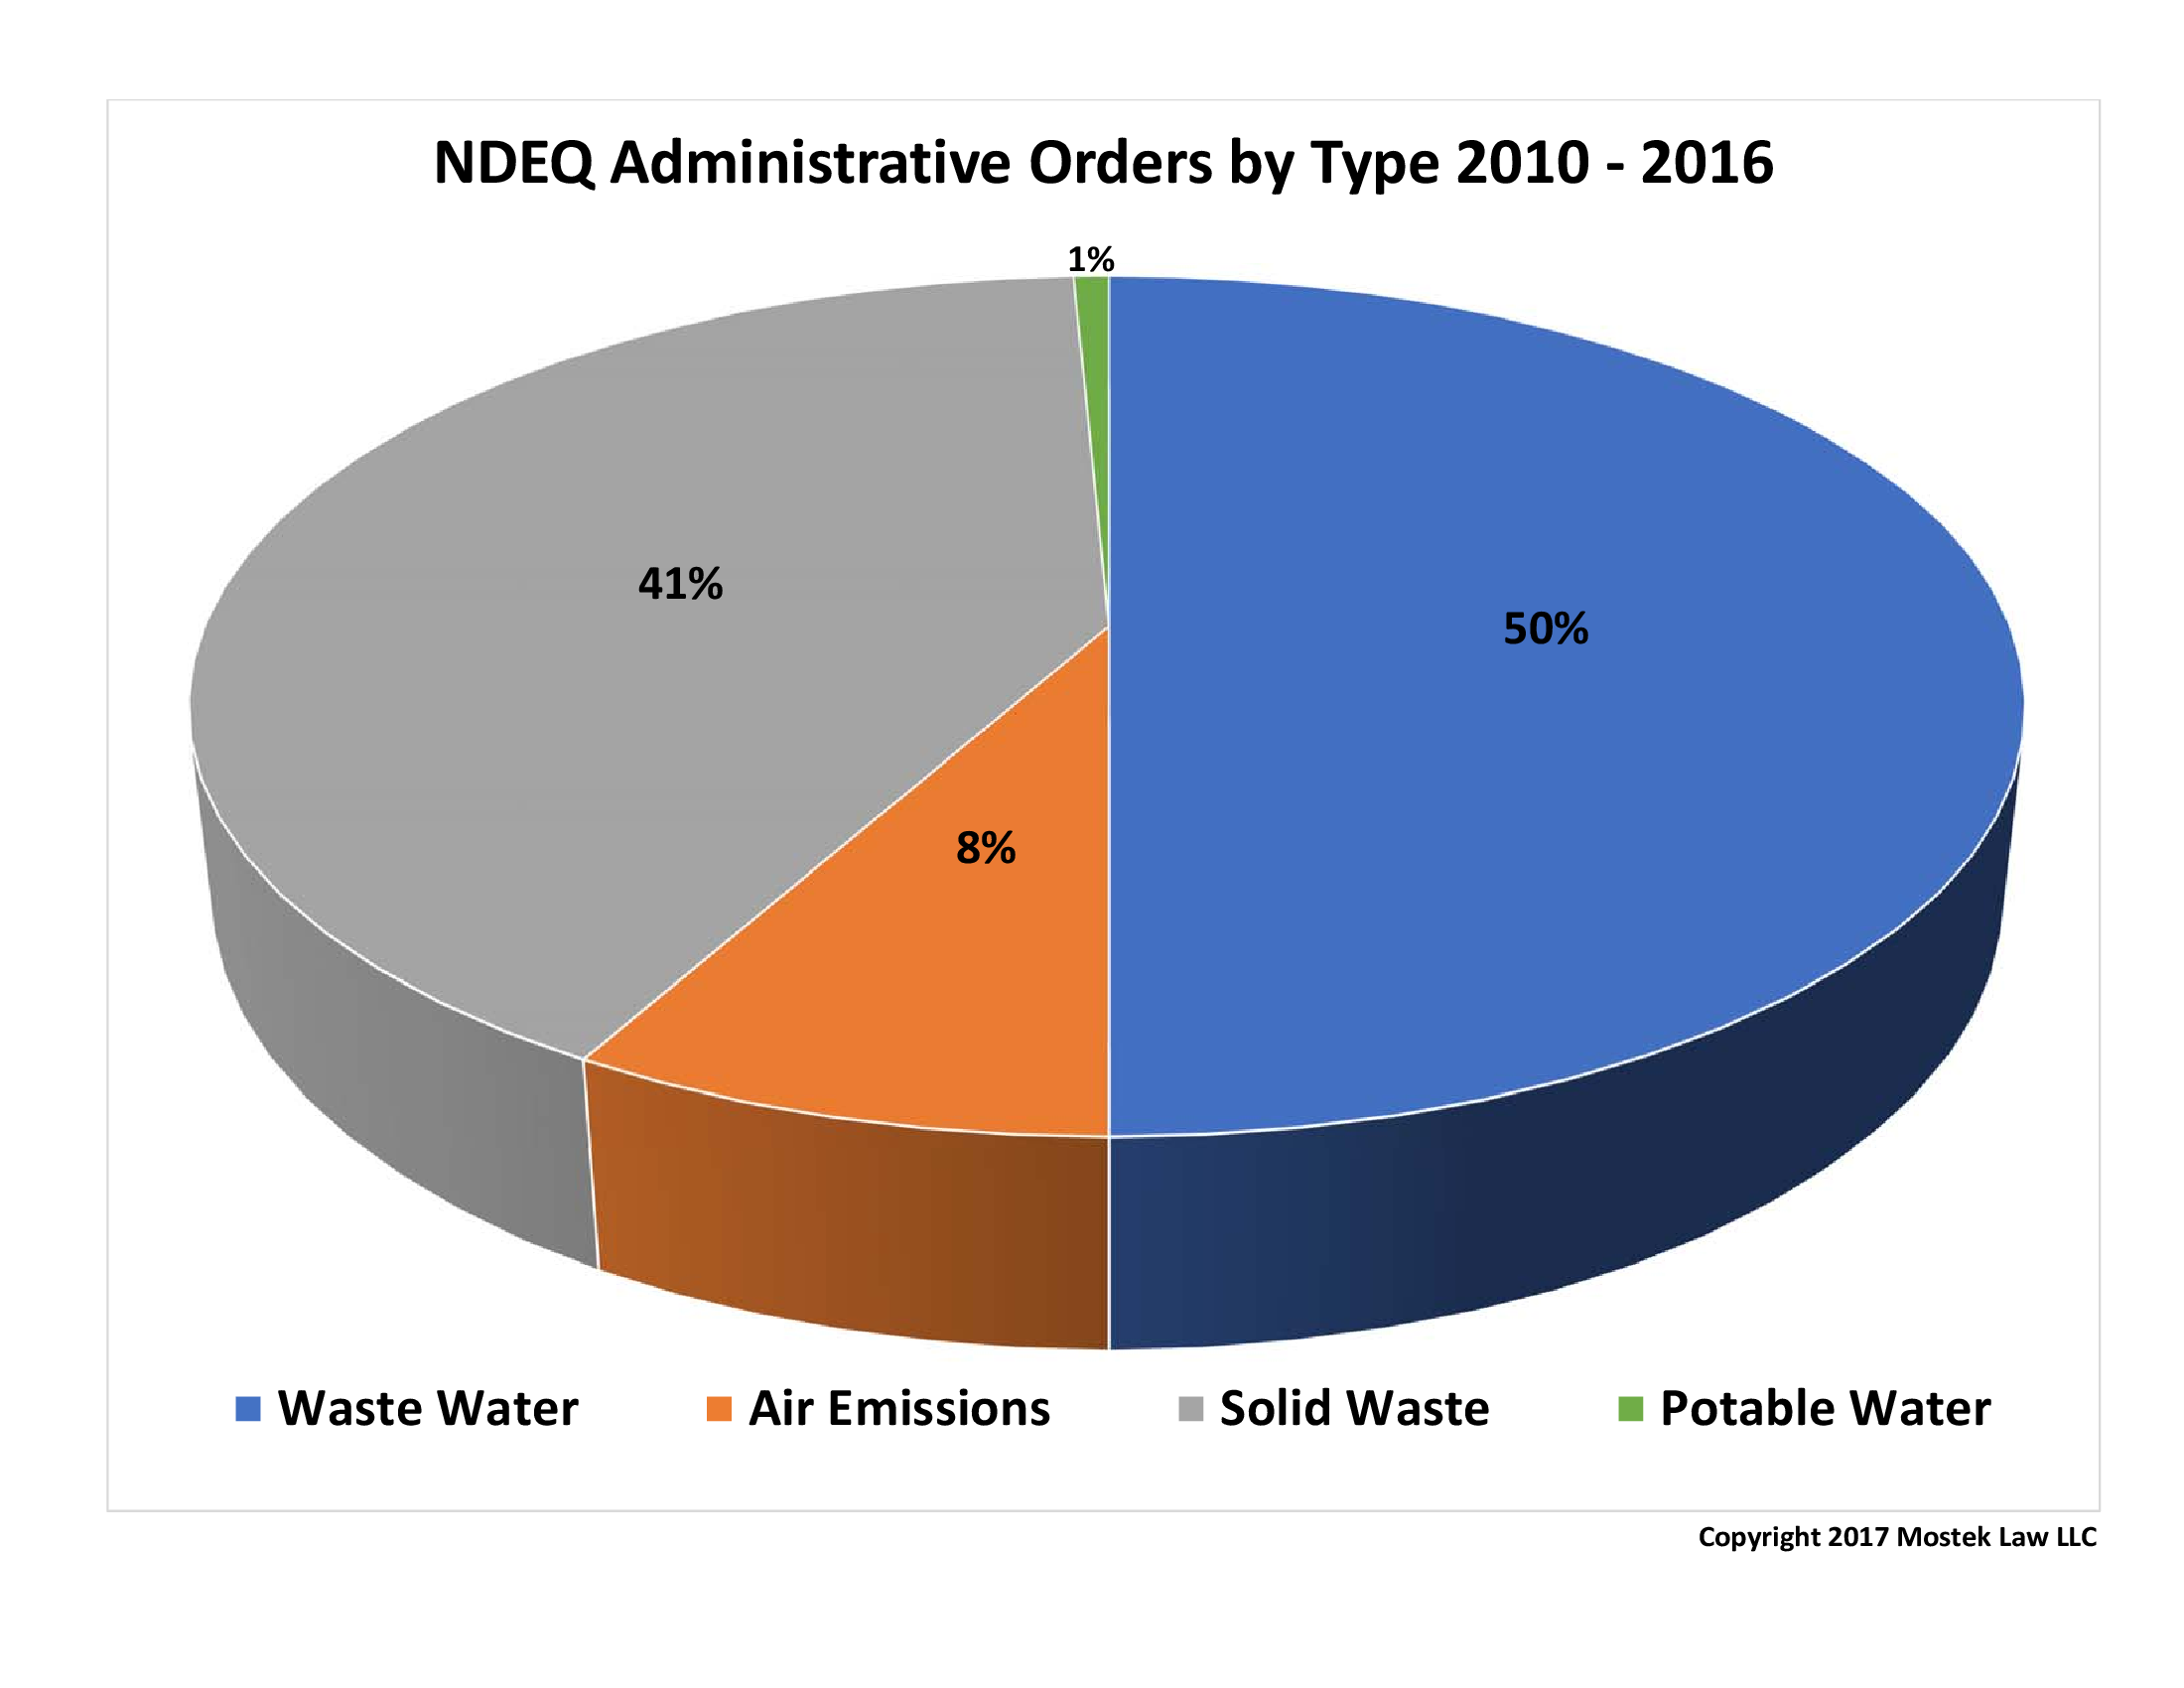
Figure 2 – NDEQ Administrative Order Summary
This allowed us to reach conclusions about enforcement trends in each area over the years.
Our staff also prepared about a dozen histograms, pie charts and other graphs to illustrate important conclusions. For example, waste water is by far the most significant waste stream in terms of the enforcement attention it receives. This is true both in terms of civil penalties and administrative orders, as shown by the charts accompanying this article. In the administrative order arena, solid waste violations finish in a close second, and civil penalty proceedings for air permit or community right to know violations follow.
NDEQ Legislative Reports. We then extended the study, reaching further back in time using the annual NDEQ reports to the Nebraska Legislature. This allowed us to gather some additional information not otherwise readily available — total civil penalties for the years 2000 through 2005. The legislative reports allowed only simple conclusions about the total annual civil penalties, but they extend our year-to-year comparison to be presented in an upcoming article.
We found two limitations inherent in the information drawn from the legislative reports. First, the reports are not consistent from year to year in terms of the information reported or how it is reported. Second, we were not able to read the complaints or settlement orders as we did for the later period.
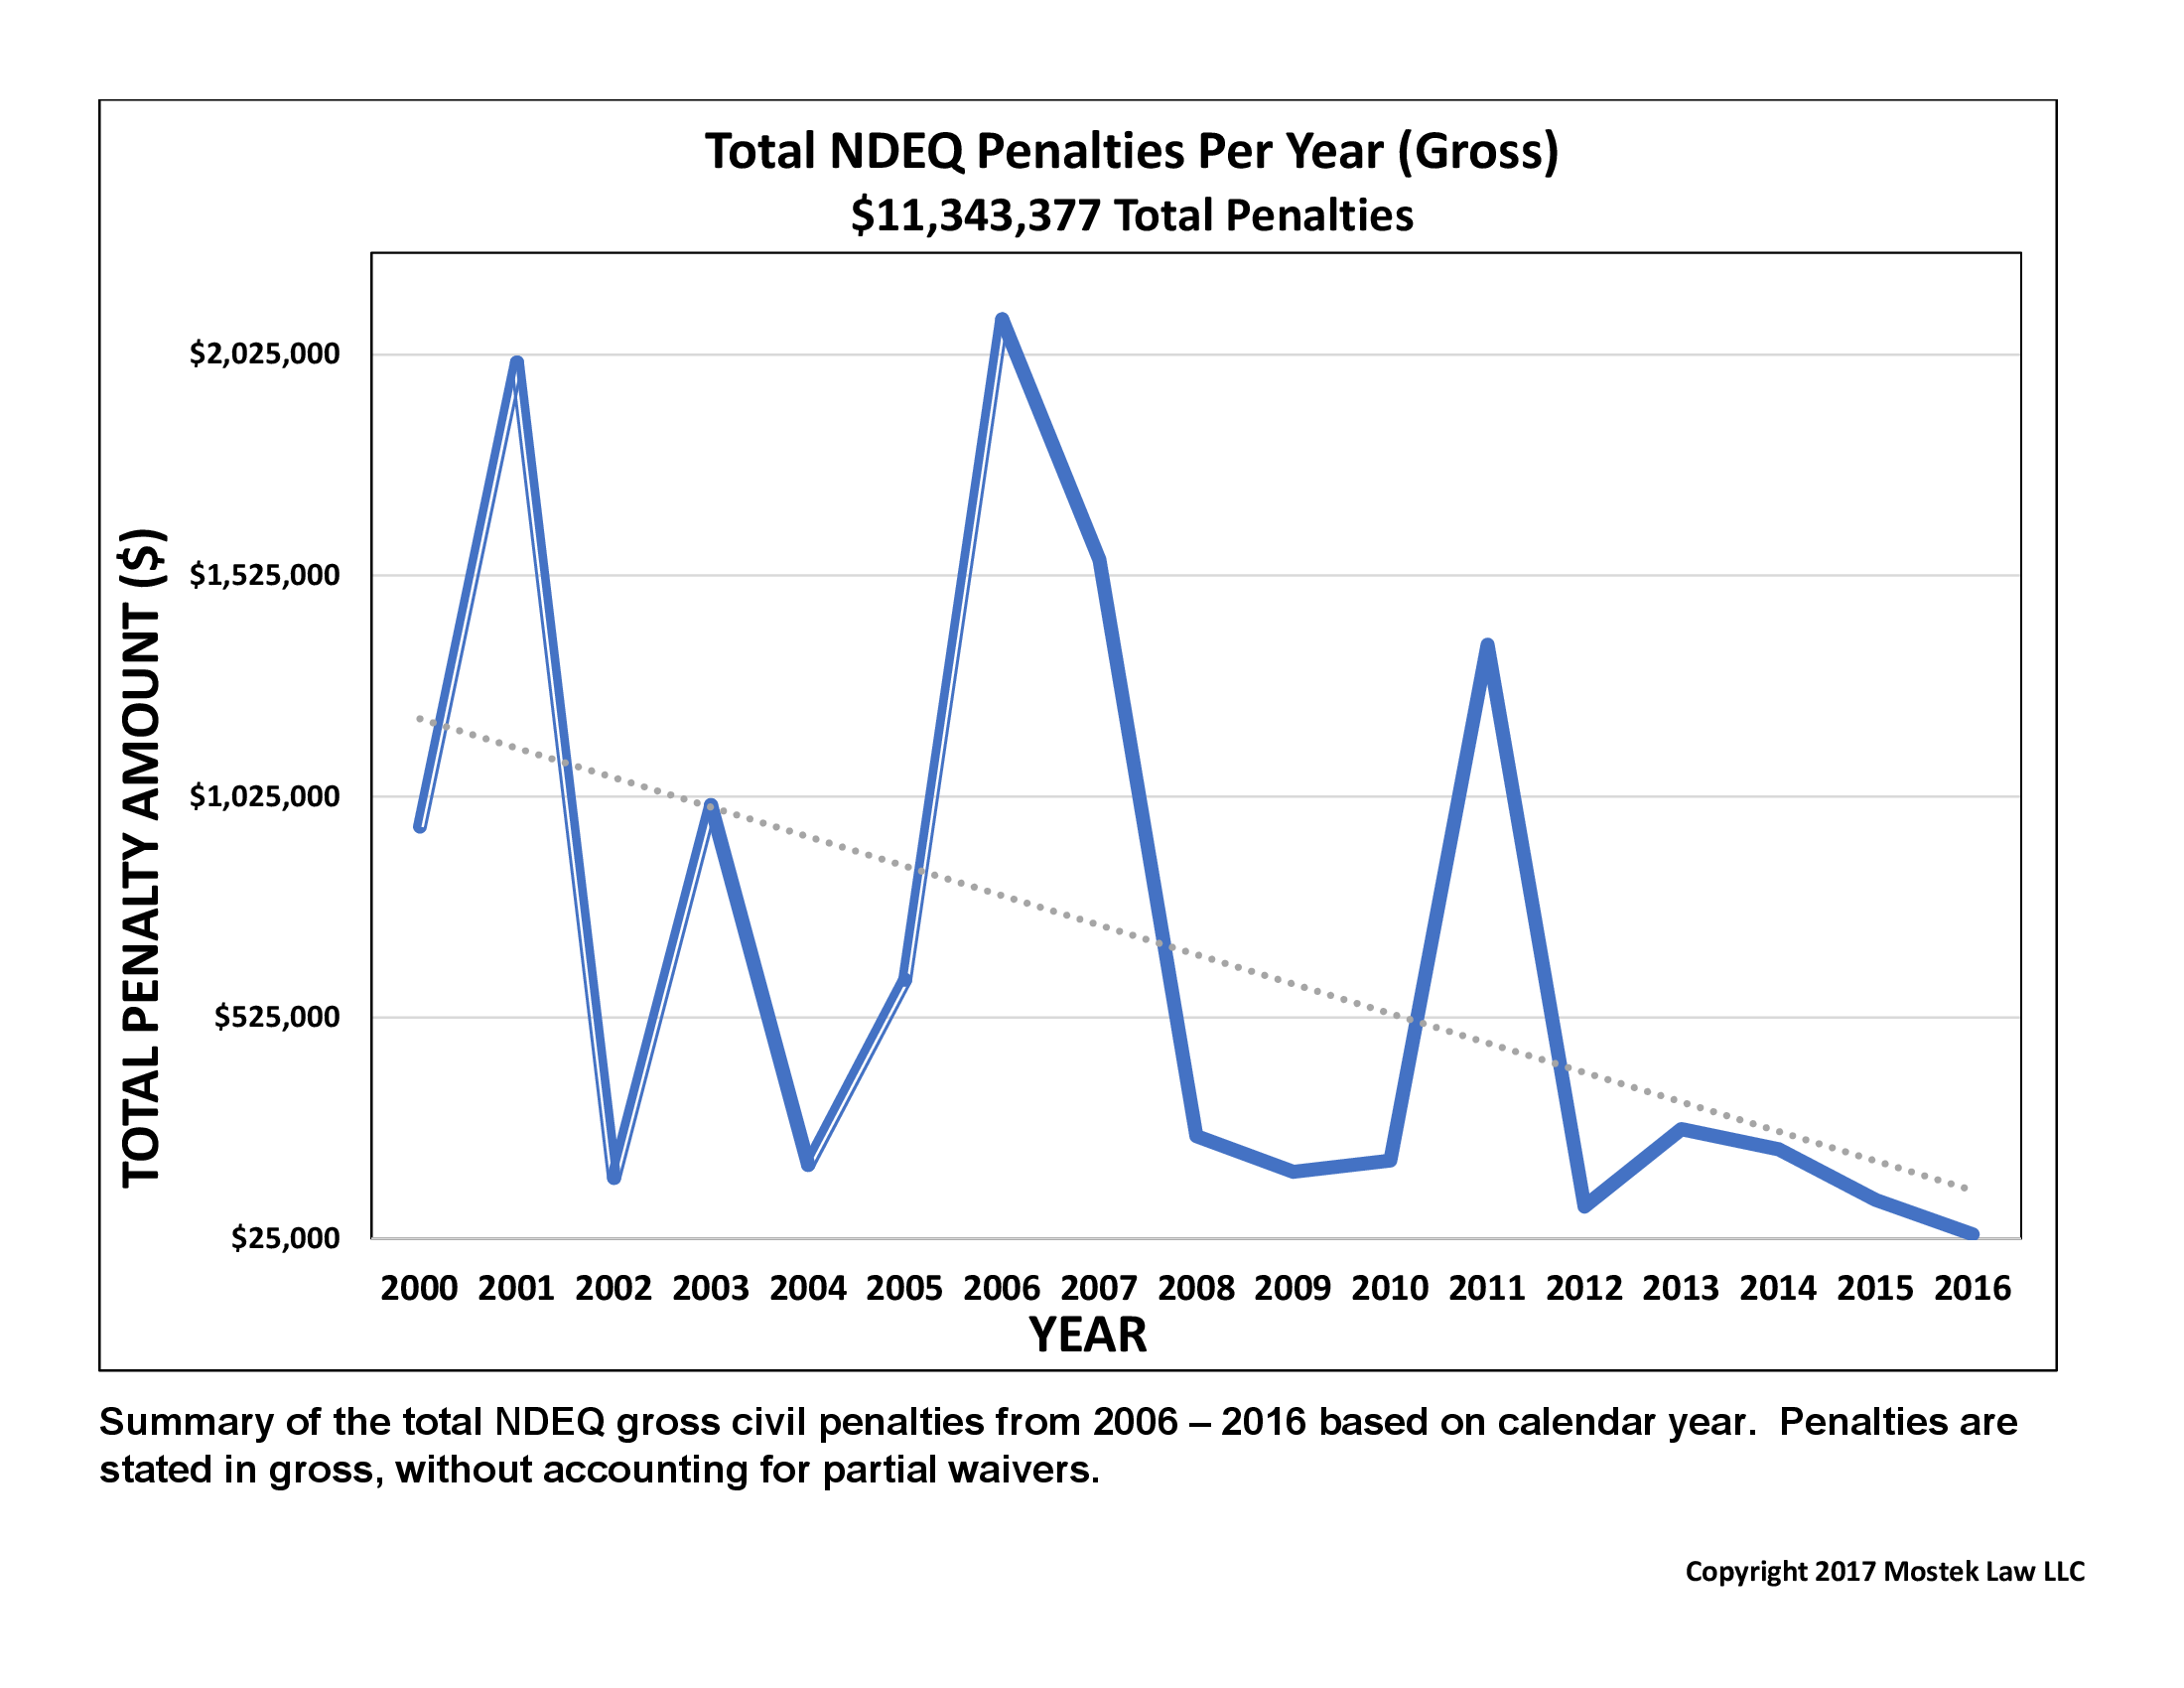
Figure 3 – NDEQ Civil Penalty Summary
That information could only be gathered by researching archived case files at the courthouses where the cases were filed more than a decade ago. For this reason, we were not able to categorize the cases for the period from 2000 to 2005.
We also found the NDEQ website lists and reports cases based on the calendar year in which they were resolved. By contrast, the NDEQ Legislative Reports contain information based on the NDEQ fiscal year (FYE September 30) of resolution. We tried to conform the data to account for these differences with an eye toward consistency in presenting the information on a calendar year basis.
However, using data from the legislative reports, we found that the total civil penalties levied from over 17 years, from 2000 through 2016 total more than $11.34 Million.
Conclusion
We intend to present the data and inform our readers. At the same time, we believe it is important the regulated community understands the costs of environmental compliance, especially the added costs that come about through enforcement.
One conclusion can be drawn for sure — if you are a gambler it is best not to gamble with your waste water. The “house” has the statistical edge.
We certainly enjoyed putting this study together. We hope you will find interest and valuable information in the series of articles to follow.
![]()
How may we serve you?
Article by: Mike Mostek
Photo by: Tim Mossholder
